THE UNKNOWN REGION
RAB BOYCE, AUGUST 2017
Introduction
Where is the best place to find statistics for Scotland’s exports and imports?
With a range of documents published on exports and imports, there’s perhaps little wonder that there has been some confusion over methodology, terminology and what these figures show. One misconception widely propagated is that the HMRC Regional Trade Statistics (RTS) are disguising the true exports of Scotland, and that Oil & Gas exports are being hidden in the "Unknown" region. This article looks at this claim and shows where to look for the facts.
There are essentially four main sources for Scottish Export numbers. These are: Quarterly National Accounts Scotland (QNAS); The Oil & Gas Statistics provided as part of the Scottish National Accounts Project (SNAP); Export Statistics Scotland (ESS); and HMRC Regional Trade Statistics (RTS). In addition, the Scottish Government's Index of Manufactured Exports (IME)
are also available but, as they are only designed to track quarter-on-quarter growth of goods and provide only chain-linked growth indicators rather than financial values, we will not cover them here. Please note that these figures show trade figures and not public revenue received via taxation.
All four sets of statistics have been created for a different purpose, use different methodologies and measures, and therefore all four show differing totals for Scotland's exports and imports.
We shall have a look at each of these in turn.
Quarterly National Accounts Scotland (QNAS)
The QNAS report
[1] is published by the Scottish Government as part of the Scottish National Accounts Programmes (SNAP) each quarter and is described as:
The QNAS report is produced by the Scottish Government and is used to determine a number of high level statistics regarding the Scottish economy including the value of International and Rest of the UK export, imports and trade balance for the onshore Scottish economy. Estimates are on a national account basis.
As GDP calculations incorporate imports and exports, QNAS includes estimations for these values for Scotland. However, as the Scottish government state:
Estimates of trade for Scotland are harder to measure than any other component of GDP because of the lack of a trade border for Scotland. While some survey data is available on export sales to RUK, estimates of imports from RUK rely on statistical modelling and supply & use balancing to produce results.
The Export and Import numbers contained in QNAS do not contain regional breakdowns for source or destination, but they do include services.
City skyline
Photo By: John Doe
Button
SNAP Oil & Gas
The Scottish National Accounts Programme (SNAP)
[2] provide Oil and Gas export statistics. These include estimates of production volumes, sales revenue and operating and capital costs. However, unlike QNAS and ESS, these have not attained the status of National Statistics.
Export Statistics Scotland (ESS)
ESS
[3] is produced by the Scottish Government on an annual basis. ESS is based on a number of sources including RTS, ONS Surveys and the Global Connections Survey. GCS is a survey undertaken by the Scottish Government where all companies with more than 100 employees are sampled in addition to representative companies from Scottish regions and sectors. For 2015 this survey gathered returns from 1506 businesses weighted by size and sector to provide an estimate of the total export value.
The Export Statistics Scotland document excludes Oil & Gas, but it does include a regional breakdown for source and destination and includes Services. The report has attained the status of National Statistics certification.
Regional Trade Statistics (RTS)
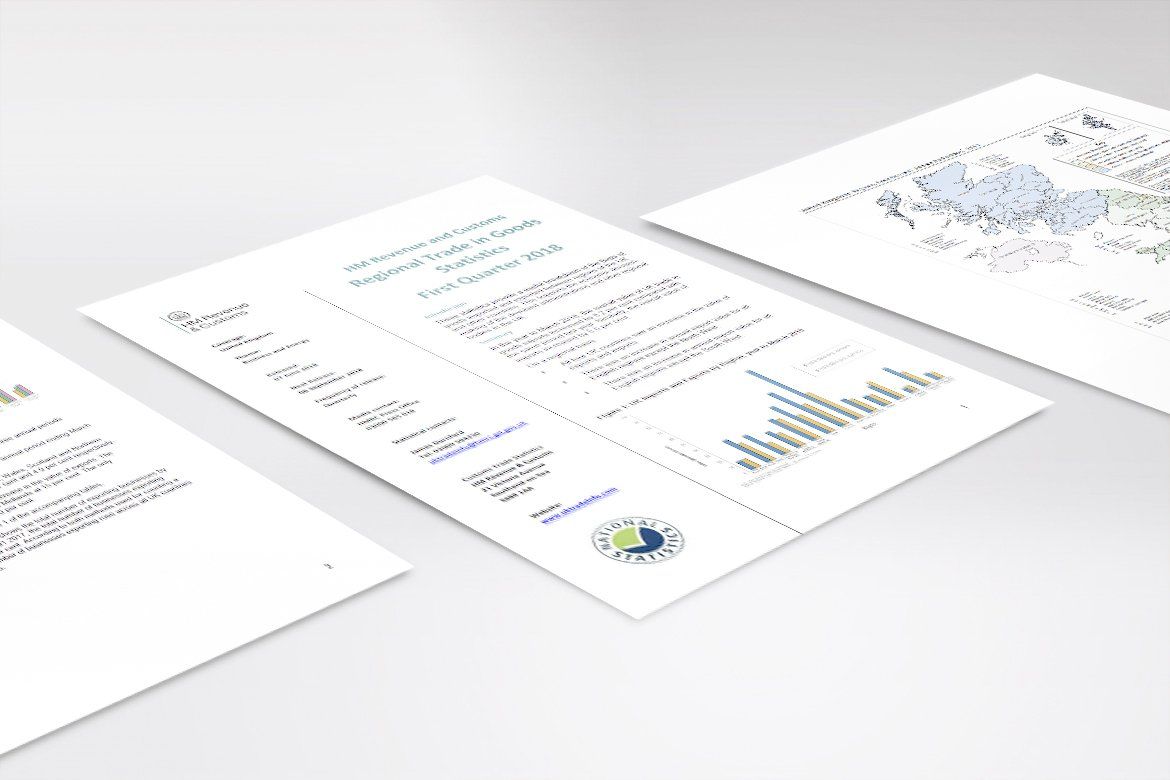
RTS is produced on a quarterly basis by HMRC for the purpose of establishing the value of physical goods are exported internationally by the UK regions.
According to the Methodology statement [4]:
HM Revenue & Customs (HMRC), formerly HM Customs and Excise, introduced the Regional Trade Statistics (RTS) series in January 1999 to support the economic decision-making of the devolved Scottish and Welsh Governments and other regional bodies within the UK.
It is important to note that RTS only includes goods and therefore excludes services and other financial transfers. This is vital to consider, as services make up a significant portion of UK exports.
Where do the RTS figures come from?
The RTS figures are based on OTS figures. OTS stands for Overseas Trade Statistics and are drawn from the Intrastat system for EU transactions and Customs Declarations for Non-EU transactions.
Regional allocations within the UK are apportioned using the following two stage process.
- Regional Trade is allocated based on the number of employees a company has in each region. This is obtained via the Interdepartmental Business Register (IDBR).
- Where no match can be obtained with the IDBR, the region is assigned based on the postcode of the registered business.
There are some exceptions to this process – Electricity and Gas are allocated based on information provided by the operators.
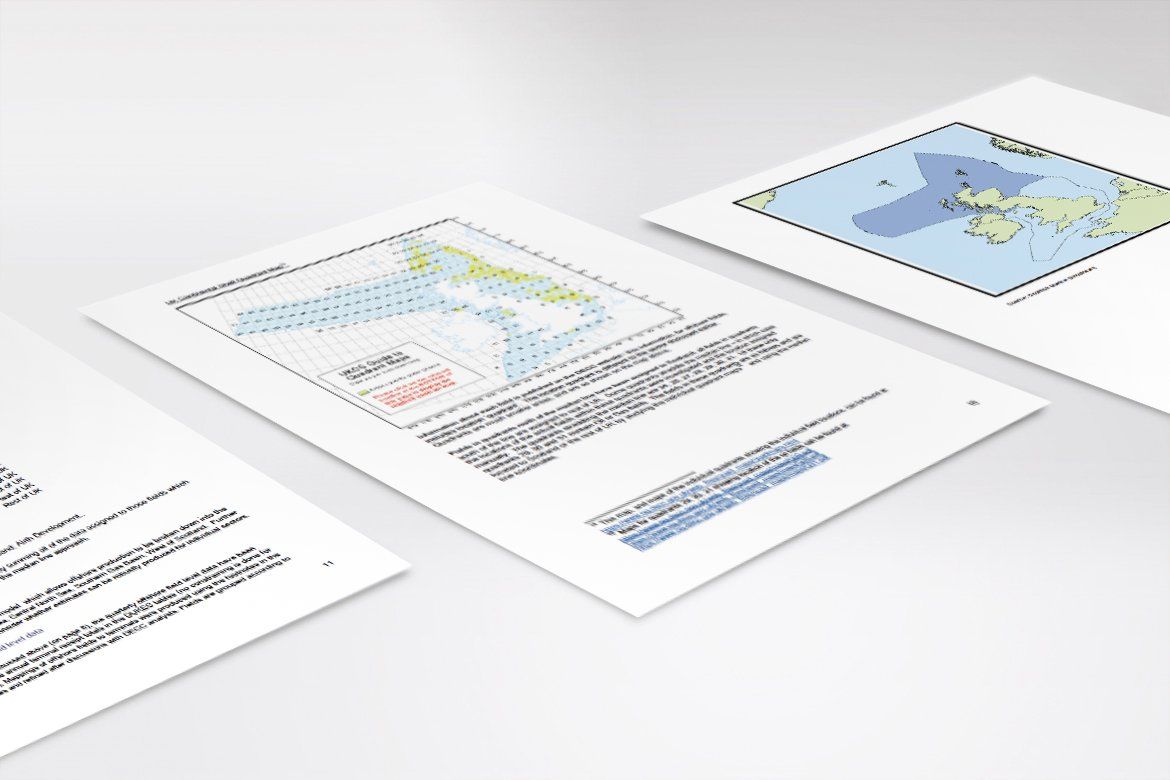
Crude Oil is also treated differently using the following methodology:
Where oil is processed on rigs in the North Sea and dispatched directly to other countries, the oil does not enter the UK and therefore does not obtain any regional coding. The RTS methodology categorises this oil trade based on the location of the oil rig. This allocation also uses information from the Scottish Adjacent Waters Boundaries Order 1999. Oil imported or exported into or out of the UK via ship will be associated with a business. Trade is allocated to the region where the business is registered subject to the main allocation method outlined above.
Prior to December 2016, Oil Exports that shipped directly from the rigs were counted towards company HQs. The methodology has now been updated as stated above. This change in methodology resulted in Scotland’s allocation within RTS of the ‘Mineral Fuels’ category for 2015 to climb from £588m to £6,825m and the allocation to the ‘Unknown’ region to fall from £8,826m to £1,529m.
Note: The Mineral fuels category includes Oil and Gas in addition to Electric Current and Coal and Coke products.
However, there is a significant amount of other trade that cannot be categorised in this way and is thus allocated to the Unknown Region:
- Overseas businesses registered in the UK as ‘ghost presences’;
- Private Individuals trade;
- Non-VAT registered entities’ trade;
- Government trade;
- Parcel Post (Parcels with a value of under £2,000).
In summary:
- RTS is based on Customs Declarations and the EU Intrastat system.
- RTS only covers goods and NOT services.
- RTS only deals only with international Trade (it does not include intra-UK trade).
- Regional Coding for most goods is based on a company’s address or a percentage split by employees where the HMRC have information about multiple branches and employee distribution.
- Regional Coding for Electricity and Gas is based on the information provided by operators.
- Regional Coding for Crude Oil is based on the location of the oil rig.
- There are valid reasons why trade cannot be allocated a region under RTS and is therefore assigned to the "Unknown" region.
CONCLUSION
RTS cannot be used to determine Scotland’s total exports as it does not include services, is largely based on VAT registration and does not include the movement of goods within the UK.
Of all the available sources, the most relevant to the discussion on Scotland’s exports are the Scottish Government’s ESS figures. ESS is the source primarily used by the Scottish Government, politicians and the media when discussing Scottish Exports. There currently is not a consolidated document that includes onshore exports as well as Oil and Gas exports, but we can use ESS, QNAS and the SNAP Oil & Gas figures to obtain a more complete picture.
Unfortunately, due to the varied nature of the different sources it is easy to use the wrong source for the wrong purpose and therefore to draw the wrong conclusions.
The most prolific example of a wrong conclusion drawn is a meme that began circulating in 2016 that suggests the ‘Unknown’ region in RTS is used by HMRC to mask the strength of Scotland’s Oil & Gas exports, and that the majority of the ‘Unknown’ Region’s exports were, in fact, Scottish Oil and Gas. A cursory examination of the headline numbers for 2015 should be enough to dismiss this. Using the pre-December 2016 methodology, total exports allocated to the ‘Unknown’ region were £22,862m [6]. Of this, the Total Mineral Fuels allocation to the ‘Unknown’ region was only 8,826m. Oil & Gas makes up a subset of this category, which includes Coke and Electricity Supply. A much better source of Scotland’s Oil and Gas exports would have been the SNAP Oil & Gas figures, which were available at the time and are, crucially, designed for this purpose. SNAP estimates that Scotland’s Oil and Gas exports outside the UK in 2015 were £6,973m. Of course, Scotland produces more Oil and Gas than this but £7,859m is ‘exported’ to the rUK. [7]
The following table provides a reference to the various sources and where to find the numbers you are looking for:
| Feature | RTS | QNAS | ESS | SNAP Oil & Gas |
|---|---|---|---|---|
| Includes Goods | Yes | Yes | Yes | No |
| Includes Services | No | Yes | Yes | No |
| Includes Oil & Gas | Partial | No | No | Yes |
| Augmented with Survey Data | Yes | Yes | Yes | No |
| Includes intra-UK | No | No | Yes | Yes |
| Regional Breakdown | Partial | No | Yes | No |
It is worth noting that, although the ESS and QNAS are produced by the Scottish Government and while the releases coincide, the numbers do differ slightly. This is because QNAS is based on 'transfer of ownership' in accordance with the ESA10 standard, and the ESS numbers are based on the 'flow of goods'.
As we can see from the final table, if one looks at each of these sources in isolation and does not understand what information they do and do not contain, one might draw an incorrect conclusion.
| Source | Imports (£m) | Exports (£m) |
|---|---|---|
| RTS | 13,005 | 17,468 |
| QNAS | 81,808 | 71,740 |
| ESS | - | 78,570 |
| SNAP Oil & Gas | 2,712 | 14,832 |
ADDENDUM
Since we published the initial article we have been asked the same question a number of times regarding the impact of the RTS methodology change with respect to oil & gas allocation on the reported Scottish GDP figures or on the fiscal position as reported in the Government Expenditure and Revenue Scotland (GERS) document. These statistics are completely unaffected by the RTS methodology changes. Scottish GDP figures are prepared by the Scottish Government's National Accounts Unit and published as Quarterly National Accounts Scotland. These statistics do not use RTS as a source or as an input. The GERS document, which covers public revenue and expenditure for Scotland, also does not use RTS as a source for its North Sea Revenue allocations. It is also worth noting that RTS is concerned with the value of exports whereas GERS is concerned with the revenue from taxation (see here
for an overview of Oil & Gas taxation). Both QNAS and GERS previously utilised the Kemp-Stephen methodology and now align with the ONS to allocate Scotland's share of North Sea production and revenue . It is therefore incorrect to claim, as some have done, that this change in RTS methodology led to a historical under reporting of Scotland's economy or tax revenue.
SHARE
REFERENCES & FOOTNOTES
REFERENCES
Both UK and Scottish Governments sometimes (and disappointingly) delete or remove pages from their websites. If the links are broken, you can download documents from our DIRECT DOWNLOADS – please do let us know if files disappear.
[4]
RTS Methodology 2016